
Built for organisations where decisions must be explainable.
IXGraph is designed for organisations where operational performance, regulation, financial accountability and organisational complexity intersect — particularly utilities, infrastructure, government and other regulated enterprises.

WHY IXGRAPH NOW?

Enterprise AI has a context problem
Most enterprise AI initiatives can access documents and databases. Far fewer have a structured model explaining how the organisation itself fits together. IXGraph creates that model.
From Generative AI to Organisational AI
Generative AI can produce an answer. Organisational AI must also understand responsibilities, dependencies, evidence and consequences. IXGraph gives enterprise AI that organisational context.

Connect rather than replace
LumosAI does not ask organisations to abandon their existing ERP, CRM, BI, workforce or operational platforms. IXGraph connects them through a common semantic layer.
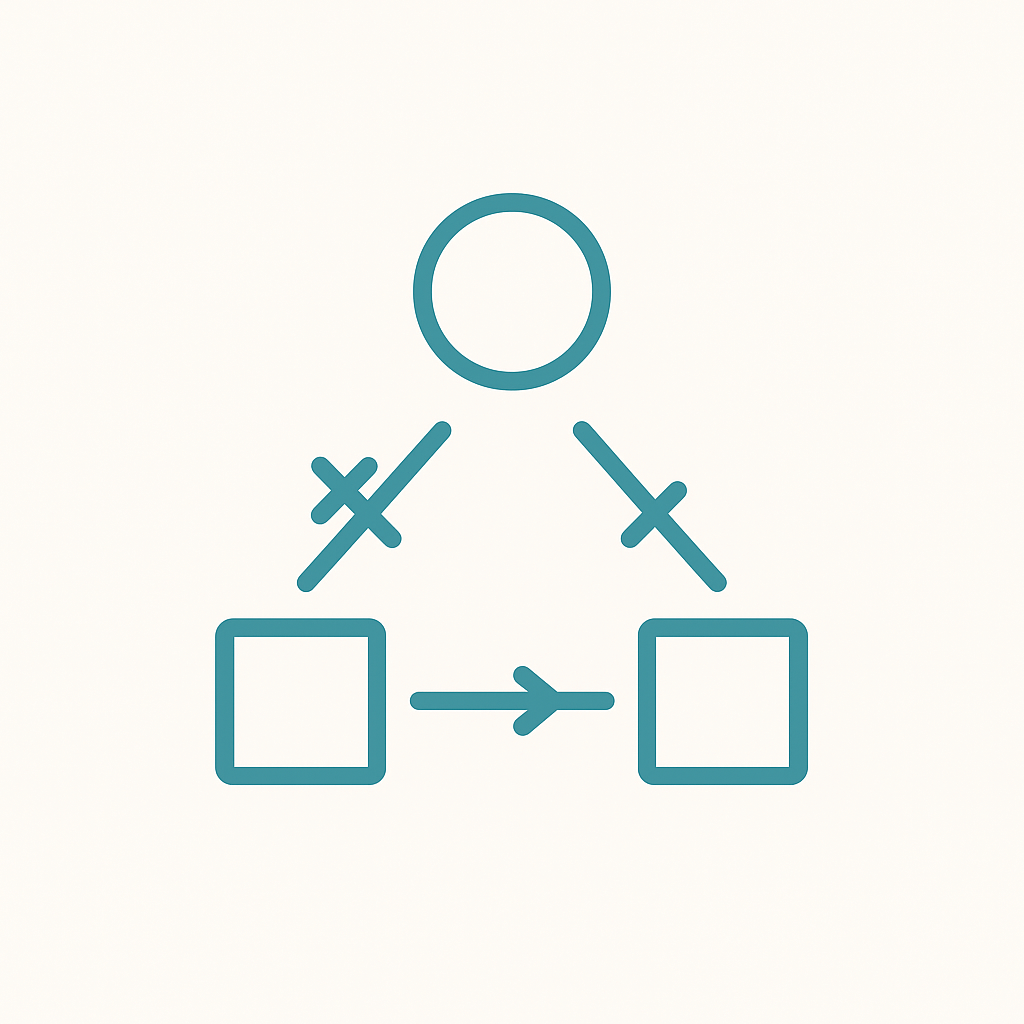
The organisational architecture for AI
Our ambition is for IXGraph to become the organisational knowledge layer between enterprise systems and AI — allowing organisations to understand themselves before asking AI to make decisions about them.
Built for regulated industries
Water & Utilities
Connect regulatory obligations, operational performance, customers, people and finance in one organisational graph.
Use IXGraph to investigate questions such as:
- Who is genuinely accountable for this regulatory outcome?
- Which organisational conditions are contributing to delivery failure?
- How does customer experience relate to operational performance?
- Which people and cost centres influence this outcome?
- Where does the evidence required by the regulator actually sit?

ENERGY & INFRASTRUCTURE
Connect assets, programmes, organisational accountability, finance, customer outcomes and regulation.
IXGraph creates an organisational layer across complex infrastructure environments, helping leadership understand how strategy translates through programmes, functions and people into operational and regulatory outcomes.
CENTRAL & LOCAL GOVERNMENT
One connected model across services, finance, governance and regulation.
Local and central government operate across multiple statutory, regulatory and governance regimes. IXGraph can connect those obligations to services, organisational structures, accountable officers, evidence, finance and outcomes — creating a common organisational model rather than another reporting silo.


REGULATED ENTERPRISE
Turn regulatory complexity into connected organisational intelligence.
Different regulatory frameworks can be represented within the same graph and connected to the organisation responsible for satisfying them.
That creates the potential for a single organisational regulatory model showing:
Obligation → Evidence → Process → Role → Person → Condition → Outcome
Professional Services
Help clients understand the organisation behind the data.
IXGraph provides consulting and technology partners with a graph-native organisational architecture that can complement transformation, AI, data, regulatory and operating-model programmes.
Rather than another point solution, IXGraph can provide the common organisational model across multiple client workstreams.

See what enterprise intelligence looks like in your sector
Our team works with senior leaders across Water & Utilities, Energy & Infrastructure, Central & Local Government, Regulated Enterprise and professional services. We’ll show you how connected intelligence applies to the specific governance, performance and risk challenges in your industry.