
One graph. Every organisational relationship
Large organisations do not have a shortage of data. They have a shortage of connection. IXGraph sits across the existing technology estate and connects organisational, financial, operational, customer and regulatory information through a common enterprise ontology. The source systems remain where they are. IXGraph makes their relationships visible.
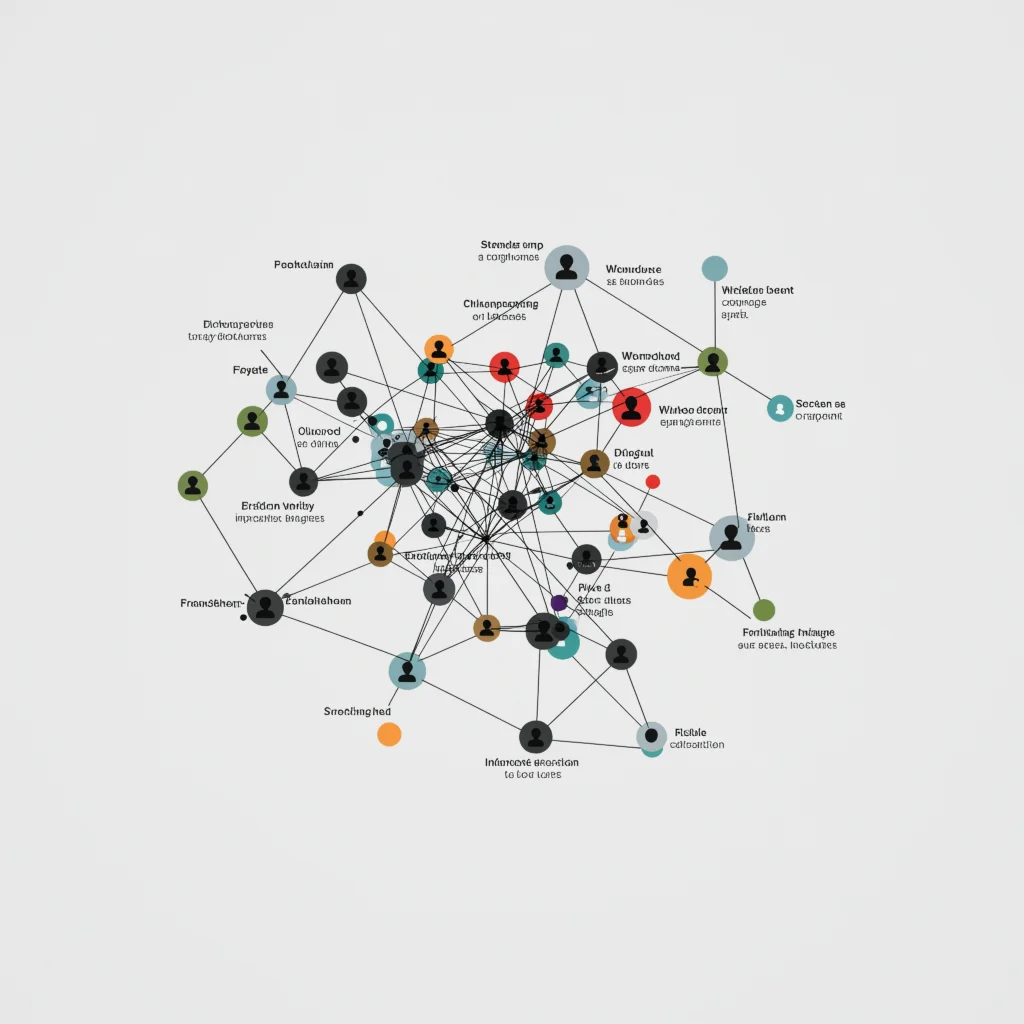
How Connected Intelligence works
IXGraph creates a graph-native representation of the enterprise. Existing systems populate a common organisational ontology. People, roles, cost centres, processes, customers, assets, obligations, outcomes and organisational conditions become connected nodes and relationships rather than isolated records.

Connect existing systems
Connect SAP, Oracle, Microsoft, Salesforce, HR, engagement, customer, regulatory and operational sources through APIs, data extracts and enterprise integration services — without requiring a wholesale replacement of the existing architecture.

Give the data organisational meaning
The IXGraph ontology establishes what each piece of information means and how it relates to the rest of the enterprise. That common language allows information from previously disconnected systems to be reasoned across together.
Build a living organisational model
As source information changes, the graph changes. Leadership can therefore interrogate the current organisational system rather than relying solely on periodic reports and static organisational charts.

Move from diagnosis to intervention
IXGraph identifies the conditions associated with an outcome, shows where they occur in the organisation and allows leaders to examine where intervention is most likely to make a difference.
See the whole system – understand what drives it
Dashboards describe the organisation. IXGraph models it.
A conventional BI environment can tell leadership that performance, expenditure, customer satisfaction or regulatory compliance has changed. IXGraph connects that outcome back through the people, responsibilities, organisational conditions, processes, financial structures and regulatory obligations that may be producing it.
- See organisational relationships that are normally invisible
- Connect financial accountability to the people actually responsible for delivery.
- Map regulatory obligations directly to accountable roles, evidence and organisational conditions.
- Identify perception gaps between different levels of management.
- Connect customer outcomes with operational and organisational causes.
- Use existing Power BI investment (or your ownBI tool) as an interface into a much richer connected model.
- Ask natural-language questions while retaining a traceable evidence path through the graph.

Bring us one difficult organisational question.
In a strategic walkthrough we will show how IXGraph could model the systems, relationships and evidence required to answer it.